Businesses can save with battery energy storage when the avoided electricity charges and eligible revenues exceed charging and operating costs. There is no fixed saving that applies to every site. As a hypothetical example, reducing billed demand by 120 kW at $18 per kW per month would avoid $25,920 a year if that reduction is achieved in all 12 billing months.
However, commercial battery storage savings are not the same for every facility. A manufacturing plant with high demand charges may benefit more from peak shaving, while a warehouse with rooftop solar may gain greater value from storing excess daytime generation. Understanding these differences helps businesses estimate commercial and industrial battery energy storage systems cost savings and determine whether the investment makes financial sense.
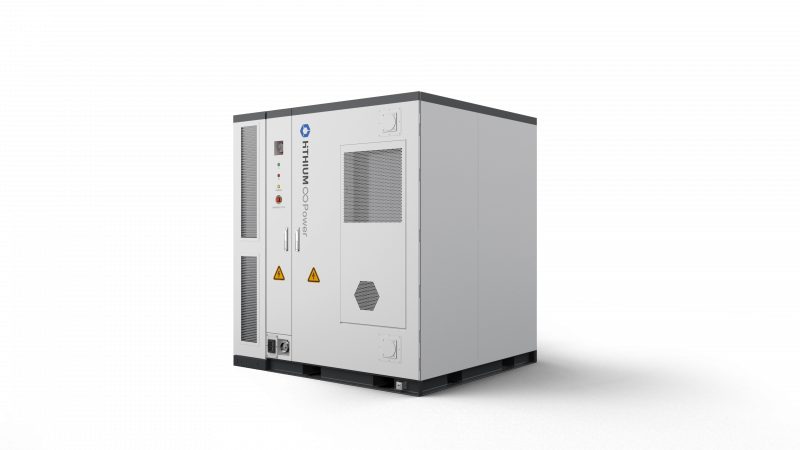
Commercial and industrial battery energy storage systems (C&I BESS) reduce electricity expenses primarily by changing when electricity is purchased from the grid and how much power is imported during peak demand periods. Four common sources of financial value are peak demand reduction, time-of-use electricity arbitrage, solar self-consumption, and participation in eligible demand response programs.
Many commercial electricity tariffs include demand charges based on the highest average power imported during a specified billing interval, commonly 15 or 30 minutes. For example, a manufacturing facility may operate several production lines, industrial compressors, and cooling systems simultaneously. If these loads create a short but substantial electricity demand peak, the resulting demand charge can account for a significant portion of its monthly bill.
A battery energy storage system can discharge during these periods, reducing the facility's measured grid demand.
Consider the following example:
Parameter | Without Battery Storage | With Battery Storage |
Monthly peak grid demand | 800 kW | 680 kW |
Demand charge rate | $18/kW | $18/kW |
Monthly demand charge | $14,400 | $12,240 |
Monthly savings | - | $2,160 |
Annual savings | - | $25,920 |
In this scenario, the battery reduces billed demand by 120 kW, producing a potential annual demand charge reduction of $25,920. The calculation assumes that the same demand reduction is achieved every month and that the tariff has no additional billing provisions that change the result. Actual savings depend on peak duration, battery availability, charging schedules, and utility rules.
Many electricity suppliers apply time-of-use pricing, meaning electricity prices vary throughout the day. Under these tariffs, businesses can purchase electricity during lower-cost periods and use stored energy when prices increase. This strategy is known as energy arbitrage or peak-valley electricity price arbitrage.
Suppose a business operates under the following conditions:
· Off-peak electricity price: $0.10/kWh
· Peak electricity price: $0.22/kWh
· Electricity used for charging: 400 kWh
· Assumed AC-to-AC round-trip efficiency: 90%
· Electricity delivered after storage losses: 360 kWh
The gross financial benefit from one charging and discharging cycle can be calculated as follows:
Value of discharged electricity: 360 kWh × $0.22 = $79.20
Cost of charging electricity: 400 kWh × $0.10 = $40.00
Energy arbitrage benefit: $79.20 − $40.00 = $39.20 per cycle
If the battery completes 250 qualifying cycles annually, the business could achieve approximately $9,800 in gross annual energy arbitrage savings. This example uses an assumed 90% AC-to-AC efficiency rather than a measured value for a specific product. Actual results depend on complete system efficiency, electricity price differences, available energy capacity, and operating conditions.
Businesses with rooftop solar panels may generate more electricity than they need during certain hours. Without battery storage, unused solar energy may be exported to the grid at a compensation rate below the retail electricity price. Battery storage allows businesses to retain eligible surplus solar generation and use it later when electricity demand increases.
Consider a commercial building with 300 kWh of surplus solar electricity available each day:
· Grid electricity purchase price: $0.20/kWh
· Solar export compensation: $0.05/kWh
· Assumed battery round-trip efficiency: 90%
· Usable electricity recovered: 270 kWh
Using stored solar electricity avoids approximately $54 in grid purchases. Exporting the original 300 kWh would have earned $15. The incremental benefit of storing this energy is therefore approximately $39 per qualifying day, equivalent to $9,750 over 250 days. Actual solar storage savings depend on export compensation, electricity tariffs, available surplus generation, and the timing of facility consumption.
Some utilities and grid operators offer financial incentives to commercial customers that reduce their electricity demand during designated events. A battery storage system may allow a factory, office building, or industrial facility to reduce grid imports without interrupting its normal operations. However, demand response payments are not available in every electricity market. Businesses should confirm program eligibility, required discharge capacity, event duration, and performance obligations before including this potential revenue in their financial calculations.
HiTHIUM's Zhejiang Petrochemical project account describes a 10 MW/20 MWh installation in Zhoushan using air-cooled storage and PCS container systems. The company reports a two-cycle daily strategy and approximately RMB 24,000 in daily economic benefits. This is a supplier-reported result for a specific industrial project, not a guaranteed saving from the current liquid-cooled cabinet range. Other sites require their own tariff and dispatch assessment. A reported daily benefit should not be multiplied into an annual result without evidence of the actual operating days and costs.
Before selecting a battery energy storage system, businesses should evaluate their existing electricity expenses and identify where stored energy can create measurable financial value.
A practical assessment can be completed through five steps.
Start by gathering at least 12 months of electricity bills and, where available, 15-minute or 30-minute electricity consumption data.
The following information is particularly useful:
· Monthly electricity consumption in kWh
· Monthly maximum demand in kW
· Peak and off-peak electricity prices
· Demand charge rates and billing rules
· Daily production or building operating schedules
· Existing solar generation and export data
· Planned facility expansion or additional electrical equipment
This information can be analyzed using spreadsheet software or energy modeling tools to identify recurring demand peaks and possible charging periods.
Not every facility should operate its battery in the same way.
For businesses with high demand charges, peak shaving may be the primary objective. For facilities with large differences between peak and off-peak electricity prices, energy arbitrage may create more value. Facilities with solar installations should also assess whether surplus solar energy can be stored and used later instead of being exported. For example, a factory with a predictable two-hour demand peak may have a different battery requirement from a warehouse with several short electricity demand spikes throughout the day.
Understanding the duration and frequency of these events helps avoid choosing a system that is too large or too small.
Battery storage systems are normally specified using two important ratings:
· Power capacity (kW): The rate at which the system can deliver electricity.
· Energy capacity (kWh): The amount of electrical energy stored or delivered under specified conditions.
For example, if a manufacturing facility needs to reduce grid demand by 150 kW for two hours, the basic energy requirement is:
150 kW × 2 hours = 300 kWh
This does not mean that a battery rated at exactly 300 kWh will necessarily provide the required output under all operating conditions. System sizing must also consider usable state-of-charge limits, conversion losses, temperature, battery degradation, and any reserve capacity required for backup power. HiTHIUM's Commercial and Industrial Energy Storage Solutions support applications such as peak shaving, load shifting, and integration with on-site renewable generation.
Once the battery operating strategy has been defined, calculate the expected savings from each applicable electricity cost component. The following example illustrates a hypothetical commercial facility using a 200 kW system with 500 kWh of nominal battery energy.
Financial Parameter | Illustrative Value |
Battery power rating | 200 kW |
Nominal battery energy | 500 kWh |
Monthly demand reduction | 120 kW |
Demand charge rate | $18/kW/month |
Annual demand charge savings | $25,920 |
Annual energy arbitrage savings | $9,800 |
Total annual gross savings | $35,720 |
Assumed annual operating expenses | $5,000 |
Annual net operating benefit | $30,720 |
These values are illustrative first-year financial assumptions, not measured savings from a HiTHIUM customer or a market quotation.
For this illustrative combined schedule, the system delivers 360 kWh of net AC energy at 120 kW over a three-hour peak-price window on 250 qualifying days. The same discharge both avoids peak-price energy purchases and reduces billed demand, provided every monthly billing peak occurs within a controlled window. Those are separate electricity-bill components, so they can be combined without counting the discharged energy twice. Assuming a 90% usable battery window and 95% discharge-path efficiency, 500 kWh nominal energy provides 427.5 kWh of usable AC energy at beginning of life, exceeding the 360 kWh event. These capacity assumptions are separate from the 90% AC-to-AC efficiency used to calculate charging costs. Future degraded capacity and any backup reserve must be assessed separately, and recharging must not create a new billing peak. These are first-year assumptions requiring verification with interval data, not guaranteed product performance.
Electricity-bill savings are only one part of the investment assessment. Compare annual net operating benefit with the full installed cost, then evaluate degradation, replacement costs and discounted cash flows. Under the illustrative values above, a $240,000 installed investment divided by $30,720 in first-year net benefit gives a simple payback of about 7.8 years if that benefit stays constant. This is a screening result, not a lifetime return forecast.
Two facilities with identical battery systems can achieve very different savings because their electricity tariffs are different.
For example, reducing monthly billed demand by 100 kW would generate:
Demand Charge Rate | Monthly Savings | Annual Savings |
$5/kW | $500 | $6,000 |
$10/kW | $1,000 | $12,000 |
$15/kW | $1,500 | $18,000 |
$20/kW | $2,000 | $24,000 |
These calculations assume that the same demand reduction is achieved in all 12 monthly billing periods. This is why electricity tariff analysis should be completed before selecting battery capacity or estimating project returns.
Round-trip efficiency (RTE) measures the proportion of electricity recovered after a complete charging and discharging cycle. For example, at an assumed 90% AC-to-AC round-trip efficiency, charging a system with 1,000 kWh would result in approximately 900 kWh of delivered electricity. The remaining energy is lost through battery processes, electrical conversion, and associated system operation. When comparing technical proposals, businesses should confirm whether efficiency is measured at the cell, DC battery, or complete AC system level.
Battery capacity changes over time because of calendar aging and repeated cycling. For businesses that plan to charge and discharge their systems regularly, battery cycle life and capacity retention influence how much usable energy remains available throughout the operating life of the project. HiTHIUM publishes a nominal cycle rating of at least 13,000 cycles for its ESS Cell 314Ah. This is an individual cell specification. Project economics should use the degradation and warranty conditions of the complete selected system rather than assume that this cell number defines installed-system life.
Battery buyers should review the test conditions, capacity retention criteria, and warranty provisions before using cycle-life figures in investment projections.
An energy management system (EMS) controls battery charging and discharging according to electricity tariffs, facility demand, solar generation, and available battery energy. For example, a battery that discharges early in the morning may have insufficient stored energy to reduce the facility's maximum demand later in the afternoon. Dispatch planning therefore has a direct impact on achievable peak shaving savings and electricity arbitrage returns.
Manufacturing facilities often experience electricity demand peaks when production machinery, air compressors, and industrial cooling equipment operate simultaneously. Battery energy storage can help reduce grid demand during these periods without requiring the business to stop production.
Warehouses may operate refrigeration systems, automated material-handling equipment, lighting, and electric vehicle charging infrastructure. Storage can support electricity demand management, especially when multiple high-power loads operate during the same period.
Shopping centers and office buildings often have recurring daily demand patterns related to air conditioning, lighting, elevators, and occupancy. Battery storage can shift electricity purchases away from expensive periods and reduce selected demand peaks.
Industrial parks may contain multiple buildings and production facilities connected through shared electrical infrastructure. With suitable metering, control systems, and electrical design, battery storage can help coordinate electricity demand and improve the use of available connection capacity.
A system may have enough discharge power to reduce a demand spike but insufficient stored energy to maintain that reduction throughout the required period.
Solution: Analyze historical electricity demand at appropriate time intervals and calculate both the required kW output and usable kWh capacity.
Calculating energy arbitrage using only the difference between peak and off-peak electricity prices can overestimate financial returns.
Solution: Include round-trip efficiency, auxiliary electricity consumption, and any relevant charging charges in the savings model.
Peak shaving, energy arbitrage, solar self-consumption, and demand response may compete for the same battery capacity.
Solution: Simulate the operating schedule using realistic state-of-charge limits and prioritize services based on their expected financial value.
The initial battery price is only one component of project cost. Installation, electrical integration, maintenance, monitoring, insurance, and potential equipment replacement also affect returns.
Solution: Compare total lifecycle expenses and expected operating benefits rather than relying on equipment price alone.
A project with high demand charges and predictable electricity peaks may generate substantially different financial results from one operating under a flat electricity tariff.
Solution: Build a site-specific financial model using actual electricity data, tariff conditions, and operating requirements.
Before purchasing a system, businesses should request a technical and financial assessment that addresses the following questions:
· What is the facility's maximum monthly electricity demand?
· How long do demand peaks typically last?
· What is the difference between peak and off-peak electricity prices?
· How much electricity must the battery deliver during each operating period?
· Will the system also support solar energy storage or emergency backup?
· What usable capacity and round-trip efficiency are expected?
· What operating expenses and maintenance requirements apply?
· How will battery degradation affect future energy savings?
· What is the projected simple payback period, NPV, and IRR?
· What utility approvals and installation requirements must be satisfied?
Businesses should compare conservative, expected, and optimistic financial scenarios rather than relying on a single projected savings figure. For example, the conservative scenario may include lower electricity price differences and higher maintenance costs, while the expected scenario uses the most likely operating conditions. This approach helps determine whether the investment remains financially attractive when electricity prices, operating schedules, or battery performance change.
Battery energy storage systems can reduce commercial electricity expenses through peak shaving, electricity price arbitrage, solar self-consumption, and eligible demand response programs. In the illustrative facility example, a 120 kW reduction in billed demand avoids $25,920 annually. When the same compatible dispatch also creates the assumed energy-arbitrage benefit, gross annual savings are $35,720 before the stated operating costs. These values follow the example assumptions and are not a forecast for another customer.
These examples demonstrate how savings can be calculated, but they do not guarantee equivalent results for another facility. For an accurate assessment of commercial battery storage ROI, businesses should consider industrial peak shaving savings, behind-the-meter energy storage economics, and the project's full operating costs. Technical factors such as round-trip efficiency, depth of discharge, and levelized cost of storage (LCOS) also influence long-term financial performance.
HiTHIUM provides commercial and industrial battery energy storage technologies for facilities with different power, capacity, and operating requirements. By matching system design to actual electricity demand and tariff conditions, businesses can develop a more realistic plan for managing long-term electricity expenses. Contact HiTHIUM with your facility's electricity bills, load profile, project location, and target savings. Our team can discuss suitable battery storage configurations and the technical requirements for your project.
Annual savings depend on electricity tariffs, peak demand, battery capacity, and operating schedules. For example, reducing billed demand by 100 kW at $15/kW per month could save $18,000 annually if the reduction is achieved every month. Additional savings may come from energy arbitrage or solar self-consumption.
Simple payback is calculated by dividing the net initial investment by annual net operating benefits. For example, a hypothetical $240,000 installation producing $30,720 in annual net benefits would have a simple payback period of approximately 7.8 years. Actual results depend on project costs, operating expenses, electricity tariffs, and battery performance.
Yes. Grid-connected batteries can charge during lower-cost electricity periods and discharge during higher-price periods. They can also reduce demand charges where the utility tariff rewards lower peak demand.
Peak shaving reduces a facility's maximum billed power demand, measured in kW. Energy arbitrage shifts electricity purchases from expensive periods to cheaper periods, with savings determined by the electricity price difference and storage losses.
Battery capacity depends on the required discharge power and duration. For example, reducing grid demand by 150 kW for two hours requires approximately 300 kWh of delivered electricity before accounting for system losses and operating reserves. Final sizing should use the facility's actual load profile.




 Previous: