The real economics of 4-hour vs 8-hour battery storage depend on how efficiently each system completes the project’s required discharge task over its full operating life. A lower equipment price does not necessarily produce a lower lifetime cost.
A complete economic comparison therefore needs to connect the required discharge profile with TCO, LCOS, and the revenue available throughout the project life.
This article explains how to establish a fair comparison, calculate TCO and LCOS, assess the additional value of 8-hour storage, and match HiTHIUM solutions to different project requirements.

A fair 4-hour vs 8-hour battery storage comparison must begin with the same project objective. Otherwise, differences in power, capacity, operating strategy, or included costs may distort the result.
Define four factors before calculating TCO and LCOS:
1. Required discharge task: Identify the MW output, usable MWh, and number of hours the system must continuously discharge.
2. Revenue application: Determine whether the project serves a short peak-price window, shifts renewable energy across longer periods, reduces curtailment, or earns capacity revenue.
3. Operating assumptions: Apply the same project life, annual cycles, charging price, degradation assumptions, availability, and discount rate to both options.
4. Cost scope: Include the same battery system, PCS, transformer, construction, grid connection, operation, maintenance, and augmentation costs.
This comparison establishes whether both configurations can complete the required task and provides a consistent basis for the following TCO and LCOS calculations.
TCO and LCOS measure two different aspects of storage economics. TCO calculates the project’s total lifetime expenditure, while LCOS calculates the cost of each net MWh delivered.
TCO = Initial investment + Operating costs + Charging costs + Augmentation and replacement costs + Decommissioning costs − Residual value
TCO component | Costs to include |
Initial investment | BESS, PCS, transformers, transportation, construction, commissioning and grid connection |
Operating costs | Maintenance, monitoring, insurance, site services and auxiliary electricity |
Charging costs | Electricity purchased or renewable energy allocated to charge the BESS |
Degradation-related costs | Capacity augmentation, battery replacement and system upgrades |
End-of-life costs | Decommissioning and recycling costs, less residual value |
The TCO model should use annual cash flows and discount future expenses to their present value when comparing alternatives with long operating lives.
Rated capacity alone cannot represent lifetime delivered energy. The calculation must also reflect:
· Annual equivalent full cycles and depth of discharge
· Round-trip efficiency and auxiliary power consumption
· Annual capacity degradation
· System availability and project life
These factors determine how much electricity the BESS actually delivers to the grid over its operating life.
LCOS = Present value of lifetime costs ÷ Present value of lifetime net discharged energy
A lower TCO does not always mean a lower LCOS. An 8-hour system may have a higher TCO but still achieve a competitive LCOS if its additional capacity is sufficiently utilized, its auxiliary consumption remains lower, and it delivers more net energy over the project life.
After calculating the TCO and LCOS of both configurations, assess whether the additional four hours of storage can generate enough revenue and avoided costs to justify the incremental cost of the 8-hour system.
The additional value may include:
· Energy arbitrage during longer high-price periods
· Additional capacity-market revenue
· Greater use of renewable energy that would otherwise be curtailed
· Avoided backup power or grid-expansion costs
· Savings from lower auxiliary consumption, augmentation, and replacement needs
The final comparison is:
Additional revenue from 8-hour storage + avoided costs > Incremental lifetime cost of the 8-hour configuration
If the additional revenue and avoided costs exceed the incremental lifetime cost, the 8-hour system may provide better project economics.
If they do not, the 4-hour system may offer a better return by avoiding investment in energy capacity that the project cannot fully utilize.
The result also depends on how each BESS is designed for its intended duration. Cell selection, system architecture, auxiliary consumption, and service life can change the TCO and LCOS inputs, while the discharge duration determines which revenue opportunities the system can capture.
HiTHIUM uses duration-specific cells and system architectures for different discharge requirements. The ∞Power 6.25MWh 4h and other utility-scale energy storage systems therefore support different project economics.
The ∞Power 6.25MWh 4h combines the dedicated ∞Cell 1175Ah with the standardized ∞Pack+ platform. Up to 72% of components can be shared between packs equipped with different cells, supporting easier replacement and maintenance.
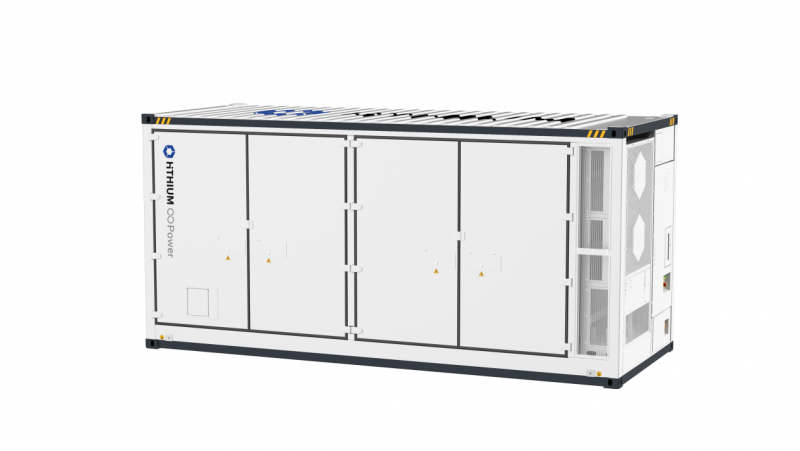
This platformized 2h/4h design creates economic value across system integration, operation, and maintenance:
· The ∞Cell 1175Ah enables a reduction of more than 30% in non-cell component costs on the DC side during system integration..
· The ∞Power 6.25MWh 2h/4h platform reduces overall costs by up to 15%.
· Its platform design reduces maintenance time by at least 50%.
· The platform supports centralized, string-type and complex-coupled PCS systems.
The ∞Power⁸ 6.9MW/55.2MWhuses a native 8-hour architecture and the dedicated ∞Cell 1300Ah 8h. One standard unit integrates one medium-voltage module and eight energy storage modules.
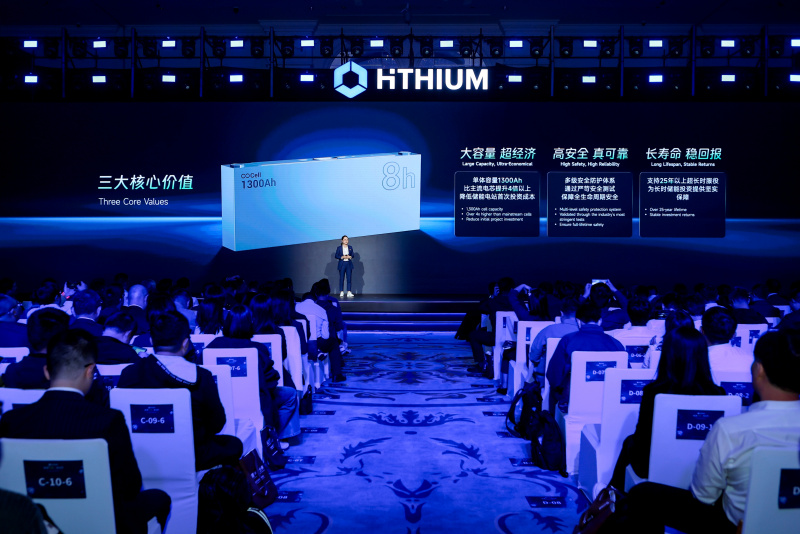
The native 8-hour designcreates economic value across system integration, operation, deployment, and service life:
· Foil and other power-component costs are reduced by more than 50% compared with 2-hour cells.
· Auxiliary power consumption is reduced by more than 30%.
· The 1300Ah cell reduces the system component count by more than 30%.
· The cell is designed for more than 25 years of operation.
· Optimized hoisting and cabling increase deployment efficiency by 18% and reduce land use by 23% versus the previous generation.
Start by comparing the verified system specifications, then match the discharge duration to the project’s operating and revenue requirements.
Product | ∞Power 6.25MWh 4h | ∞Power⁸ 6.9MW/55.2MWh |
Discharge duration | 4 hours | 8 hours |
Energy capacity | 6.25 MWh | 6.9 MWh |
Cell | ∞Cell 1175Ah LFP cell | ∞Cell 1300Ah 8h |
Configuration | 4 × 1P416S | 4 × 1P416S |
Cooling method | Liquid cooling | Liquid cooling |
BMS communication | CAN/RS485/Ethernet | CAN/RS485/Ethernet |
l ∞Power 6.25MWh 4h may be evaluated when the required discharge task can be completed within four hours or when the additional duration would not generate enough revenue to justify the corresponding increase in energy capacity. Its platformized design helps reduce system-development complexity and maintenance time, supporting lifecycle cost control without adding capacity that the project is unlikely to use.
l ∞Power⁸ may be evaluated when the project requires continuous eight-hour discharge, longer renewable energy shifting, or access to value streams beyond the first four hours. It becomes economically preferable when the additional revenue and avoided lifecycle costs exceed the incremental cost identified through the TCO and LCOS calculations.
The real economics of 4-hour vs 8-hour battery storage depend on whether the additional duration creates enough value to justify its incremental cost. Projects should first define the required discharge task, calculate TCO and LCOS under consistent assumptions, and then add energy, capacity, curtailment-reduction, and avoided-cost benefits.
The ∞Power 6.25MWh 4h may suit projects whose required power, capacity, discharge task, and revenue window can be met within four hours. The ∞Power⁸ 6.9MW/55.2MWh may suit projects where continuous eight-hour operation creates additional value that exceeds its incremental lifetime cost.
Contact HiTHIUMto assess the duration and system configuration for your project.
[1] National Renewable Energy Laboratory. Storage Technology Modeling Input Data Report.
https://www.nrel.gov/docs/fy21osti/78694.pdf